Let the AI Coding Agent open the browser and troubleshoot by itself: Chrome DevTools MCP practice
You are working on a React page. The code can be compiled and no errors are reported in the terminal, but when I open the browser I only see a blank space.
You hand the code to the AI Coding Agent:
The page cannot be opened, please help me fix it.
The agent reads the component and guesses that it may be a problem with routing, interfaces, state initialization, or CSS. It changes two files and allows you to refresh the page. Still white screen. You have to open DevTools and copy the Console error to it; after repairing it, you find that the interface returns 401, and then send a screenshot of the Network panel…
The problem is not that the Agent cannot debug at all, but that it only gets the static codeand does not see thebrowser scene.
If the Agent can open the page by itself, reproduce the operation, read the Console, check the Network, take a screenshot, and then return to code location and repair, the process will be completely different:
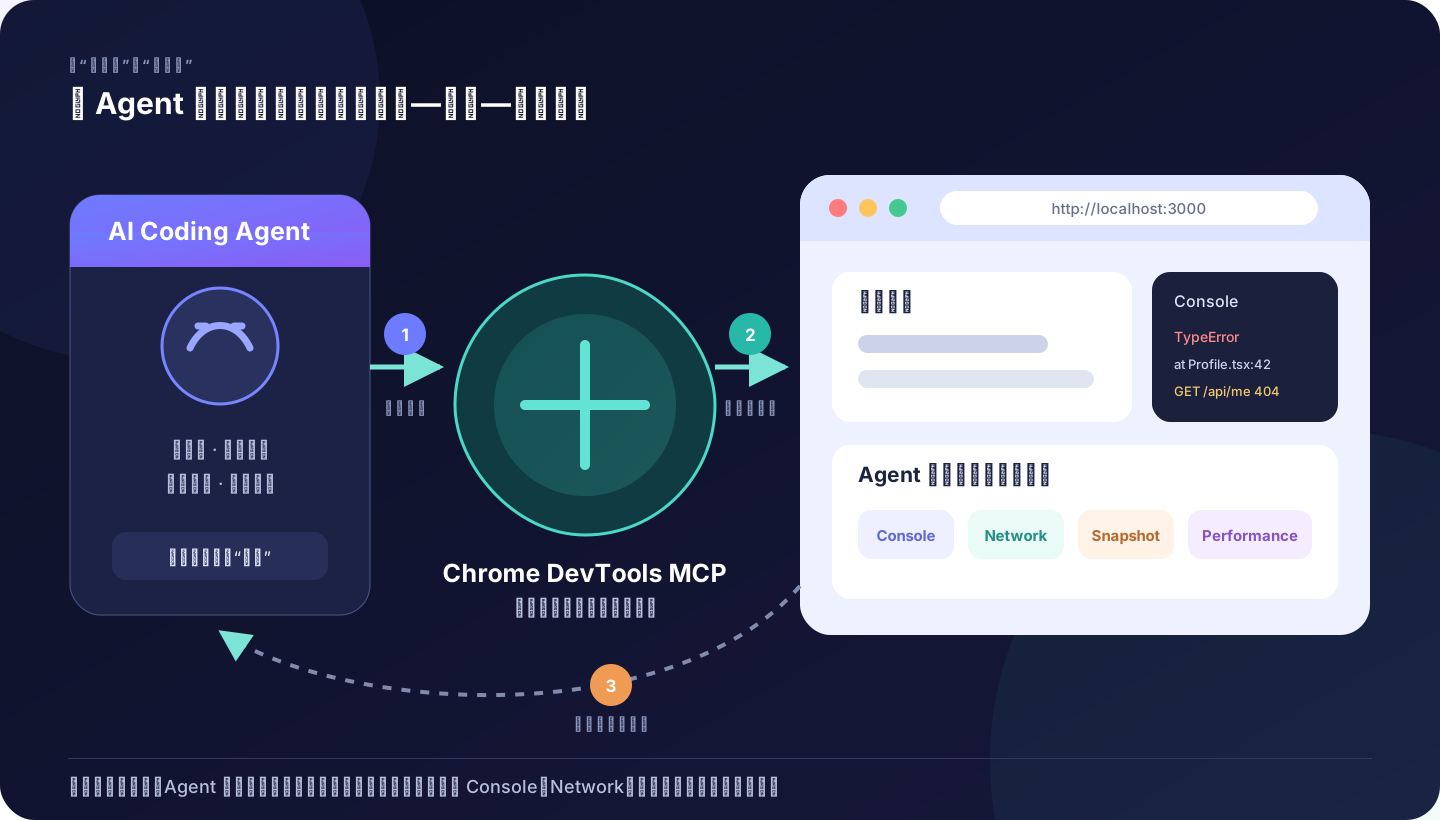
This article will take you through this closed loop. We will connect Chrome’s official chrome-devtools-mcp to Cursor, Claude Code or Codex, and then let the Agent complete the front-end problem by itself:
Reproduction → Forensic → Location → Repair → Refresh → Re-verifyNote
This is not a “must install universal MCP”
If your AI Coding tool already provides browser capabilities that can read Console and Network, use the ready-made capabilities first. Add Chrome DevTools MCP only if existing tools don’t see the required runtime information.
1. What capabilities does it add to Agent?
Chrome DevTools MCP is an MCP Server maintained by the Chrome DevTools team. It packages browser debugging capabilities into Tools that Agent can discover and call. Official Project Description.
After access, the Agent can do more than just “open web pages”:
| Capabilities | What Agents Can See | Common Uses |
|---|---|---|
| Page navigation and interaction | Pages, DOM snapshots, buttons, forms | Reproduction of user operations |
| Console | Error reporting, warnings, source map stack | Locating runtime exceptions |
| Network | Request, status code, response details | Troubleshooting 404, 401, CORS, interface format |
| Screenshots and page snapshots | Actual visual results and interactive structures | Check white screen, misalignment, status |
| Performance Trace | Loading and running performance insights | Troubleshooting slow and long tasks on the first screen |
| Lighthouse | Accessibility, SEO and other inspections | Proactive QA before going online |
| Memory analysis | Heap Snapshot and reference chain | Troubleshooting memory leaks |
The current official tool list includes navigate_page, list_console_messages, list_network_requests, take_screenshot, performance_start_trace, lighthouse_audit, etc. See Chrome official tool description.
Key changes: Agent no longer just guesses based on code
When there is no browser evidence, the Agent’s common reasoning is:
This component may have accessed
user.namewhenuseris empty. I will add an optional chain first.
After having the browser evidence, it can say:
Console displays
TypeError: Cannot read properties of undefined, and the source map points toProfileCard.tsx:42./api/mein Network returns 200, but the response field isdisplay_nameand the code readsdisplayName. The root cause is that the front-end and back-end fields are inconsistent.
The latter is not only more accurate, but also easier to accept: reload the page after repair to confirm that the Console no longer has exceptions and the interface results are rendered correctly.
2. First determine: which browser capabilities you need
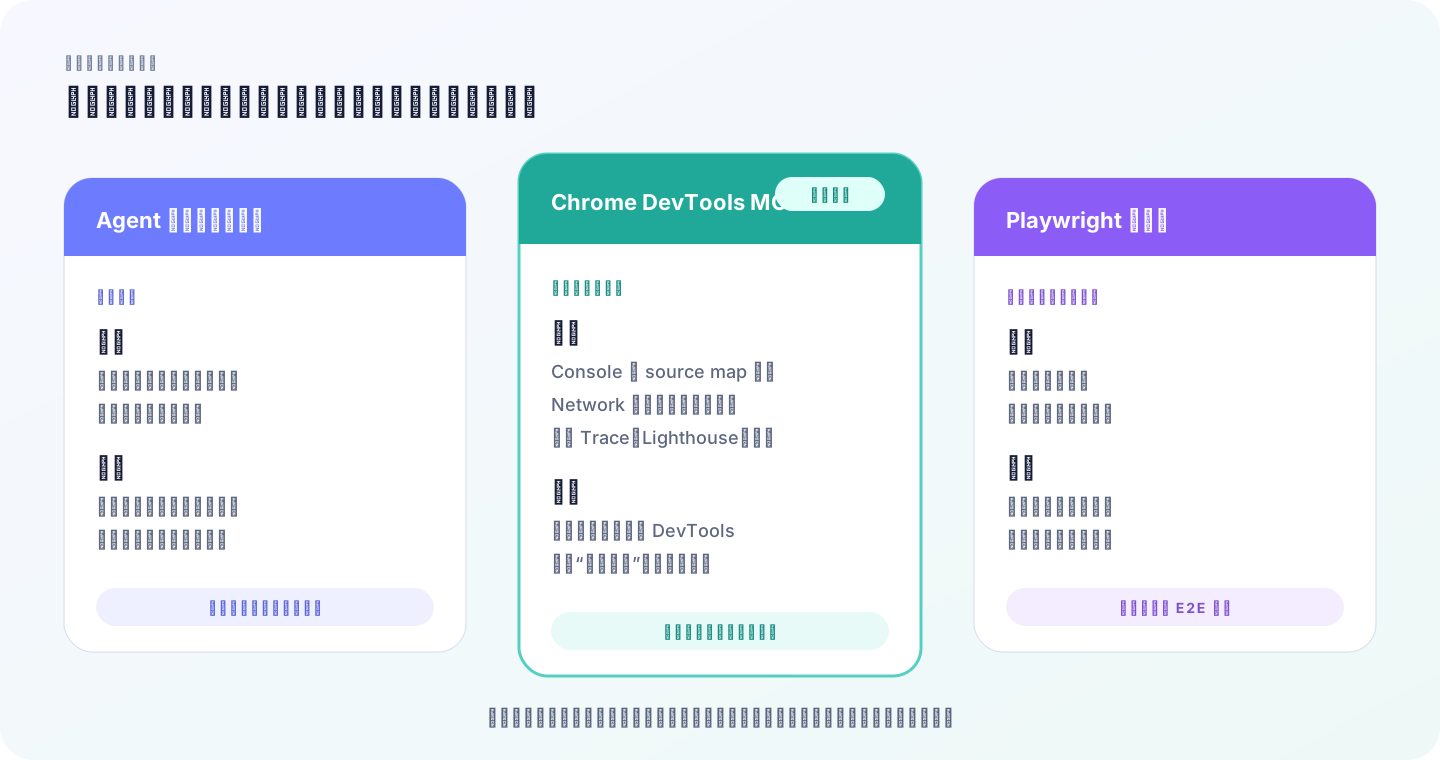
Existing browser tools: use them first if they are available
Some AI Coding products or plug-ins already provide page navigation, clicks, screenshots and even Console reading capabilities. First check the Agent’s current tool list and ask directly:
Can you now open
http://localhost:3000, read the browser console and fail the Network request? Tell me about the available tools first, without modifying the code.
There is no need to install an MCP with overlapping functionality if both the answer and the actual tool list indicate it can be done.
Chrome DevTools MCP: Favored “deep troubleshooting”
It is suitable for:
- Read the Console stack with source map;
- View requests and responses;
- Do performance Trace, Lighthouse and memory analysis;
- Connect to a running Chrome debug site.
This is closest to front-end developers opening DevTools themselves to troubleshoot problems.
Playwright tools: biased towards “stable process”
Playwright tools are more suitable for running out a user journey stably, such as “log in - add shopping cart - checkout”, and finally settle it into an end-to-end test.
The two are not mutually exclusive:
- Temporarily located a weird front-end bug: Chrome DevTools MCP;
- Turn defined replication steps into long-term regression testing: Playwright;
- Just open the page, click twice, and take a screenshot: the existing built-in browser is usually enough.
3. Get started quickly in 10 minutes
Next, you only need to select one of Cursor, Claude Code, and Codex. Do not install the same Server repeatedly using the same tool in multiple ways.
Prepare the environment
Chrome DevTools MCP official requirements:
- Node.js LTS;
- npm;
- Current stable version or newer of Google Chrome.
First check in the terminal:
node --version
npm --version
Then directly test whether the MCP Server can be started:
npx -y chrome-devtools-mcp@latest --helpIf the last command fails to run, do not change the Cursor, Claude Code or Codex configuration yet. Prioritize troubleshooting Node, npm, network proxy, or package download issues.
Tip
npx will download and run the npm package. Do not use @latest unconditionally for a long time in a team environment: quickly verify it according to the official example first, and then fix the version number that has been reviewed to avoid sudden changes in tools or behaviors in an update.
Method A: Cursor
Cursor supports project configuration and global configuration:
- Current project:
.cursor/mcp.json - All items:
~/.cursor/mcp.json
It is recommended that the first experience be placed in the current project to facilitate clear scope of action. Create .cursor/mcp.json:
{
  "mcpServers": {
    "chrome-devtools": {
      "command": "npx",
      "args": [
        "-y",
        "chrome-devtools-mcp@latest"
      ]
    }
  }
}
You can also open:
Cursor Settings → MCP → New MCP ServerThen use the same configuration. After the configuration is successful, confirm in the MCP settings that the Server is connected and the Tools are visible. By default, Cursor Agent will request approval before calling MCP Tool, and the parameters can be expanded to view. Cursor MCP official document.
If you are also using the Cursor Agent CLI, run:
cursor-agent mcp list
cursor-agent mcp list-tools chrome-devtools
Method B: Claude Code
The most direct way to install stdio:
claude mcp add chrome-devtools --scope user -- \
  npx -y chrome-devtools-mcp@latest
Then check the status:
claude mcp list
claude mcp get chrome-devtools
--scope user means available to all projects of the current user. Claude Code also supports the local and project scopes; teams preparing to submit project-level .mcp.json should first complete a source, parameter, and permissions review.
Chrome DevTools MCP also provides Claude Code Plugin installation method, which installs MCP and supporting Skills together:
/plugin marketplace add ChromeDevTools/chrome-devtools-mcp
/plugin install chrome-devtools-mcp@chrome-devtools-plugins
When you just want to quickly experience MCP, use the CLI method; when you need officially packaged debugging guidance, consider Plugin. Don’t install it both ways at the same time. The above commands are from Chrome DevTools official installation instructions.
Method C: Codex
Run in Codex CLI:
codex mcp add chrome-devtools -- \
  npx -y chrome-devtools-mcp@latest
Check whether registration is successful:
codex mcp list
codex mcp get chrome-devtools
Codex will write the MCP Server into its own configuration system. The equivalent TOML structure is roughly:
[mcp_servers.chrome-devtools]
command = "npx"
args = ["-y", "chrome-devtools-mcp@latest"]
The official Codex manual recommends: Use MCP when the required context is outside the warehouse, the data changes frequently, and you want Codex to obtain information through tools rather than pasting content; at the same time, do not connect all the tools at the beginning, and connect one or two first to eliminate the ability of real manual loops. Codex MCP Configuration Instructions.
Windows 11 If startup fails
The Codex Windows configuration officially given by Chrome will explicitly start npx through cmd and increase the startup timeout:
[mcp_servers.chrome-devtools]
command = "cmd"
args = [
  "/c",
  "npx",
  "-y",
  "chrome-devtools-mcp@latest",
]
env = {
  SystemRoot = "C:\\Windows",
  PROGRAMFILES = "C:\\Program Files"
}
startup_timeout_ms = 20_000
4. First call: Don’t just say “Help me take a look”
Just because the installation is complete does not mean that Chrome will pop up immediately. The official description is: **Only when the Agent calls a Tool that requires a browser for the first time, the Server will start the browser. **
Start your front-end project first, for example:
npm run devThen give the Agent this prompt word:
Please use chrome-devtools to open http://localhost:3000。

This step is only for observation and does not modify the code:
1. Wait for the page to load;
2. Read the errors and warnings in the Console;
3. List Network requests with status code 4xx/5xx;
4. Take a screenshot of the current page;
5. Associate each piece of evidence to a possible source code location;
6. Give the most likely root cause and verification method.

If the page requires operation to reproduce, first tell me the steps you are going to perform.
This prompt is better than “Look at the page for me” in that:
- URL specified;
- Tools specified;
- Obtain evidence first, don’t rush to make changes;
- Explicitly require Console, Network and screenshots;
- Require evidence to be linked to source code;
- Explain the steps first when there is interaction.
What you should see
A normal calling process is usually:
- Agent selects
new_pageornavigate_page; - Start Chrome and open the local page;
- Agent calls
list_console_messages; - Agent calls
list_network_requests; - Read a specific message or request details when necessary;
- Agent uses
take_screenshotortake_snapshotto obtain the page status; - Agent summarizes evidence.
If the MCP shows “Connected” but Chrome does not appear, it is likely that the Agent has not actually called the browser Tool.
5. Run a complete front-end bug fix
Assume the page code is:
async function loadProfile() {
  const response = await fetch("/api/profile");
  const data = await response.json();
  setProfile(data);
}
The actual error reported on the page:
SyntaxError: Unexpected token '<', "<!doctype "... is not valid JSONWhen only looking at the source code, the Agent may guess:
- The backend returned HTML;
- The interface address is incorrect;
- The development server fallback reaches
index.html; - Jumped to the login page after the login failed.
These are possible. The correct thing to do is to have it check Network.
Round 1: Reproduce and establish an evidence chain
Open http://localhost:3000/profile and a white screen appears.

Don't modify the code yet. Please provide a complete chain of evidence:
- What you see on the page;
- What is the first root error of Console;
- Corresponding request URL, status code and Content-Type;
- Whether the response is JSON, HTML, or a redirect;
- Which source code file and line the source map points to;
- How did you rule out other possible causes.
Suppose the Agent discovers:
GET /api/profile → 404
Content-Type: text/html
Response starts with <!doctype html>
Console points to src/api/profile.ts:12
At this time, “returning HTML” is just a phenomenon, and “requesting a path that does not exist” is a closer explanation to the root cause.
Round 2: Minimal Fixes
Make minimal fixes based on the browser evidence just now.

Require:
- No changes to irrelevant components;
- For non-2xx responses, explicitly report an error first instead of direct response.json();
- Indicate which files were modified;
- Run existing tests or type checks when finished.
Agent may change the code to:
async function loadProfile() {
  const response = await fetch("/api/v1/profile");

  if (!response.ok) {
    throw new Error(`Profile request failed: ${response.status}`);
  }

  const data = await response.json();
  setProfile(data);
}
The third round: Return to the browser for acceptance
Now go back to the same page and reload to verify the fix:

1. The original reproduction steps must be re-executable;
2. The Console no longer displays the abnormality just now;
3. /api/v1/profile returns 2xx and JSON;
4. The page displays user information;
5. Screenshots as visual evidence;
6. If there is still a warning, distinguish between "this introduction" and "originally existing".

Don't infer success based on code alone; new browser results must prevail.
Only here does a real closed loop form.
Six or four sets of practical prompts that can be copied directly
1. White screen and runtime exception
Open <URL> and a white screen appears.
First collect Console, failed Network requests and page snapshots without modifying the code.
Find the earliest root error that occurred, and do not regard subsequent cascading errors as the root cause.
Map the stack trace to the source code location in the warehouse and propose minimal fixes.
After repair, reload and verify with the same evidence items.
2. Interface and login issues
Open <URL> and execute <steps>.
Check the URL, method, status, redirect, Content-Type, and response summary of the relevant request.
Cookies, Authorization, Tokens or complete personal data may not be exported.
Determine whether the problem is front-end parameters, authentication status, CORS, gateway or back-end response.
Report the evidence and judgment first, and then wait for my confirmation whether to modify the code.
3. Responsive layout
Check <URL> with 390×844 and 1440×900 respectively.
Complete <user action>, comparing layout and interactivity at two sizes.
Record horizontal overflow, occlusion, text truncation, and non-clickable elements.
Each issue provides screenshots, affected elements, and possible CSS sources.
After repair, retest with the same dimensions.
4. Performance troubleshooting
Open <URL> and use the Chrome DevTools performance tool to record a cold start Trace.
Identify the top 3 issues that impact above the fold and differentiate lab data from CrUX field data.
Give the trace evidence, code location and expected benefits corresponding to each conclusion.
Don't do a massive refactor first; start with minimal verifiable optimizations.
After optimization, re-record Trace and compare the results before and after.
7. Recommended security configuration
The browser may have login status, cookies, customer information and internal systems. Chrome officials clearly remind: This MCP can view, debug and modify the content in the browser and should not be used in browser instances that have access to sensitive information.
Newbies are given priority to use isolation Profile
Launching a dedicated browser by default is already safer than taking over your daily Chrome. You can also use --isolated to create a temporary user directory each time and clean it after closing:
{
  "mcpServers": {
    "chrome-devtools": {
      "command": "npx",
      "args": [
        "-y",
        "chrome-devtools-mcp@latest",
        "--isolated",
        "--no-usage-statistics",
        "--no-performance-crux",
        "--redact-network-headers",
        "--screenshot-format=webp",
        "--screenshot-max-width=1440"
      ]
    }
  }
}
These parameters are used respectively for:
--isolated: Use temporary browser profile;--no-usage-statistics: Turn off MCP Server usage statistics;--no-performance-crux: Performance analysis does not request CrUX field data;--redact-network-headers: Hide some sensitive request headers;- WebP and width limit: Reduce the amount of Token and data when screenshots enter the context.
Warning
Isolated Profiles do not retain daily login status. Don’t just let the Agent take over the main Profile with email, payment, and backend management systems just to save one login.
When to connect to Chrome you are using
When you really need to reuse the login status or manually debug the site, you can:
- Chrome 144+: Enable remote debugging at
chrome://inspect/#remote-debugging, then use--auto-connect; - Or start the debug port, use
--browser-url=http://127.0.0.1:9222.
At this point the MCP may see all windows of the selected Profile. Only use it after clearly understanding the scope and closing irrelevant and sensitive pages. For detailed steps, see Chrome Official Connection Guide.
Do not enable Auto-run by default
When debugging a local page, reading the Console and Network is generally low risk; clicking Delete, Publish, Pay, and Send Message is a different story.
suggestion:
- Navigation, reading, and screenshots can be simplified and confirmed according to project strategies;
- Form submission, upload, deletion and external write operations retain confirmation;
- Agents are not allowed to bypass login, verification code or permission prompts;
- Separate test accounts and production accounts;
- The local development address and production address should be written clearly in the prompt.
8. The most common installation and connection problems
1. npx ... --help fails
examine:
node --version
npm --version
which node
which npx
Common reasons:
- Node is not LTS or the version is too old;
- npm Registry, proxy or certificate issues;
- The PATH obtained when the AI Coding tool is started is different from the terminal;
- Windows actually requires
npx.cmdorcmd /c npx.
2. MCP displays disconnected or startup timeout
First run in a normal terminal:
npx -y chrome-devtools-mcp@latest --helpIf the terminal succeeds but the Agent fails, it is usually because the environment variables or executable paths are different. You can use the absolute path of node / npx in the MCP configuration and view the product’s MCP Server log.
When more detailed logs are needed:
DEBUG=* npx -y chrome-devtools-mcp@latest \
  --log-file=/tmp/chrome-devtools-mcp.log
3. Connected, but the browser does not start
Connecting to Server does not automatically launch Chrome. Let the Agent perform an explicit browser task:
Use chrome-devtools to open http://localhost:3000 and read the page title.4. Agent looked at the wrong tab
Let it first:
List all current pages and URLs, select the page corresponding to http://localhost:3000 and continue.If multiple Agents control the same browser concurrently, contention may occur. The simplest method is to use --isolated for each session; for complex concurrency scenarios, study the official page ID routing.
5. There is nothing in the Console
The error may only appear after the first load or after a certain interaction. Requirements Agent:
- Select the correct page;
- Reload;
- Follow the complete steps to reproduce;
- Read the Console again;
- Also check Network.
6. The local page cannot be opened from the container, WSL or remote environment
localhost always refers to the network environment where the current process is located.
If the Agent/MCP Server is in a container or remote host, and the development server is on the host, http://localhost:3000 may not be in the same place. need:
- Let the development server listen to accessible addresses;
- Do port forwarding;
- Or have the MCP connect to the Chrome debug port that is enabled on the host.
First draw clearly “where the code, Dev Server, MCP Server, and Chrome run respectively”, and do not blindly change the port.
9. Precipitate a successful debugging into project capabilities
Installing the MCP is only the first step. What the team really wants to reuse is the debugging method.
You can write in AGENTS.md, Cursor Rules or project Skill:
## Browser verification

- After the front-end changes are completed, verification will be given priority at http://localhost:3000.
- Reproduce and record the Console, Network and screenshots first, and then modify the code.
- Failed requests only record necessary fields; Tokens, cookies or complete personal data must not be output.
- You must use the same operation path to return after repair.
- Success criteria include:
- The page target status is visible;
- No new Console error;
- The key request status is correct;
- Run type checking and project testing.
- Production sites only allow read-only inspections and do not perform commit, delete, publish, or pay operations.
If a user journey requires repeated regression, turn it into a Playwright test instead of forever relying on natural language ad hoc operations.
This forms three layers of capabilities:
MCP: Let Agent see the browser
Rules/Skill: Tell Agent how to debug
Automated testing: turning stable processes into long-term quality gates
10. Minimum practices starting from today
Don’t install a dozen MCP Servers at once. Just complete these five steps today:
- Confirm whether the current Agent can read Console and Network;
- If not, follow this article to connect a tool to Chrome DevTools MCP;
- Use
npx ... --helpand MCP list to confirm that the Server is normal; - Let the Agent perform an “observation only, no modification” forensic task on a local page;
- Let it complete one more repair and browser regression.
The acceptance criterion is not “a green dot appears in the configuration”, but that the Agent can give:
- Repeatable steps to reproduce;
- Console/Network/Screenshot evidence;
- The root cause corresponding to the source code;
- Modifications with clear scope;
- Fixed browser receipts.
This is the most practical value of MCP in AI Coding: **It is not to make the Agent look like it can operate the browser, but to let it use real runtime evidence to complete a more reliable engineering closed loop. **
Authoritative information
- Chrome DevTools for agents official introduction
- Chrome DevTools MCP official repository and installation instructions
- Chrome DevTools MCP Troubleshooting
- Cursor MCP official document
- Claude Code MCP official document
- Codex MCP official document
- Previous article: MCP Panorama Guide: How AI can securely connect the real world