AI Coding Token Usage: Understand the Burn Before Reaching for ccusage
A twenty-line fix can consume more tokens than a five-hundred-line feature
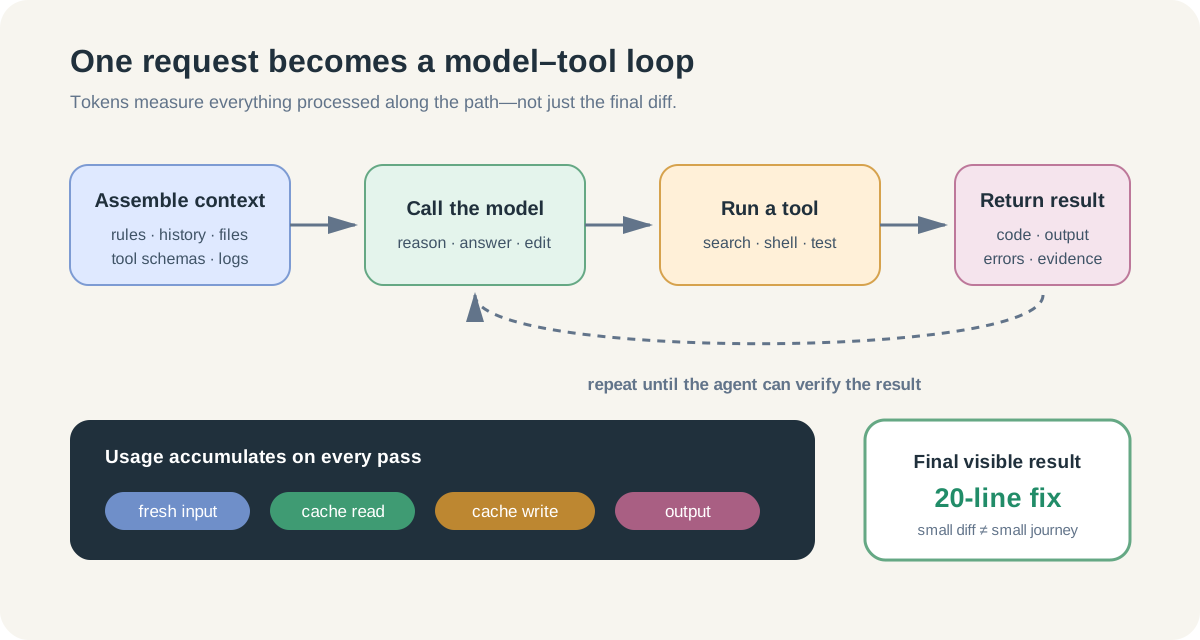
You ask an AI coding tool to fix a small bug. It searches the repository, reads a dozen files, runs a test that prints a long log, tries one explanation, rejects it, edits two files, and runs the tests again. The final diff is twenty lines.
If you judge the task by the diff, it looks tiny. If you judge it by the model’s work, it was a long investigation.
This is the first useful idea in token analysis: tokens measure what passed through the model, not how many lines survived in Git.
That distinction matters more than any particular reporting tool. Claude Code, Codex, and Cursor already expose useful usage information. ccusage does not reveal a secret, more “professional” truth. It reads the local records produced by supported coding CLIs and reorganizes them for historical analysis.
This article therefore starts with the system, not with ccusage. By the end, you should be able to explain:
- why one short prompt can lead to a large token total;
- what native views in Claude Code, Codex, and Cursor actually tell you;
- when ccusage adds value, and when it does not;
- how to turn a usage spike into a concrete change in the way you work.
1. One task is usually many model calls
The text you type is only one ingredient. Before each model call, an AI coding tool may assemble a package containing:
- system instructions and tool definitions;
- project rules such as
AGENTS.md,CLAUDE.md, or Cursor Rules; - relevant conversation history;
- files, search results, diagnostics, screenshots, and terminal output;
- summaries or memory carried forward from earlier work.
The model then produces text, reasoning, tool calls, or edits. A tool result comes back, the agent decides what to do next, and another model call begins. A single user request can therefore become a loop:
assemble context → call model → run tool → add result → call model againThe important consequence is easy to miss: much of the same context can be processed again on later turns. Prompt caching may make repeated material cheaper, and compaction may summarize older history, but neither turns a long agent trajectory into a single call.
The four token buckets you will often see
| Bucket | Plain-language meaning | Typical source in AI Coding |
|---|---|---|
| Input | Fresh material sent to the model | Your request, rules, selected code, new tool output |
| Cached input / cache read | Previously cached material reused | Stable system prompts, repeated conversation prefix, tool schemas |
| Cache creation / write | Material prepared for later reuse | A new stable prefix or large reusable context block |
| Output | Material generated by the model | Replies, code, tool calls, and model-visible reasoning where reported |
These are accounting categories, not four independent files on disk. Providers and tools expose them differently. The same text may also tokenize differently across models, so a raw token count is not a universal unit of engineering effort.
Do not confuse four different “limits”
People often say “my tokens are almost gone” while referring to four different things:
| Number | The question it answers |
|---|---|
| Current context usage | How full is this conversation’s working memory? |
| Session token total | How much model traffic has this session accumulated? |
| Plan or rate-limit usage | How close am I to a product allowance or time window? |
| Billed usage | What will the provider actually charge the account? |
A context window can be nearly full while the subscription still has plenty of allowance. A local cost estimate can be high while a subscription includes that activity. A plan limit can be reached even though the current conversation is short, because other sessions or products share the allowance.
Before interpreting any number, ask: which of these four questions is this number answering?
2. Start with the tool’s own view
Native views are usually the best place to answer “what is happening right now?” They understand the live session, the current model, product-specific limits, and features that a generic parser may not know.
Claude Code: context, session usage, and plan limits
Claude Code has two particularly useful views:
/contextvisualizes what is occupying the current context window and can surface heavy tools, memory, and other context sources./usageshows current-session token and estimated-cost details for API users; for subscribers it also shows plan usage bars, activity, and a local breakdown./costis an alias.
Claude Code can also place context percentage and estimated session cost in a customizable status line. The official documentation is explicit that the dollar figure is calculated locally and can differ from the authoritative bill. Recent versions also distinguish the current context-window counts from cumulative session totals, which is another reason to read the label before comparing numbers. See Claude Code cost tracking, commands, and status-line fields.
Use the native view when you want to know whether this conversation is bloated, whether a rule or MCP server is dominating context, or how close the account is to a Claude plan window.
Codex: current context and rate limits
In Codex, /status shows the chat ID, current context usage, active model, and rate limits. /statusline lets CLI users keep fields such as context statistics, token counters, rate limits, model, Git branch, and session ID visible in the footer.
That makes Codex’s built-in display useful for an immediate decision: continue the current task, compact the conversation, or start a fresh one. The official Codex command reference documents both /status and the configurable status line.
It is still a live product view, not a personal month-end ledger. Current context usage tells you about pressure inside this chat; it does not by itself explain which project consumed the most tokens over the last four weeks.
Cursor: visual context diagnosis and account usage
Cursor separates two useful perspectives:
- In the editor, the Agent context display shows how the current context is being used. Since Cursor 3.3, the context breakdown can attribute space to categories such as rules, skills, MCPs, and subagents. This is excellent for diagnosing why a conversation feels crowded. See the Cursor 3.3 context usage announcement.
- In the Cursor dashboard, Usage and Billing views show account or team activity, model usage, resource consumption, and spending information, subject to plan and role. The Cursor dashboard documentation describes these account-level views.
This is more visual than a terminal report and may already answer everything you need. If your question is “why is this Cursor Agent context so full?” or “how much Cursor usage is on this account?”, opening Cursor’s own interface is the sensible first step.
3. The numbers do not all come from the same place
It is tempting to imagine every usage screen as a different window over one universal local database. That is not how these products work.
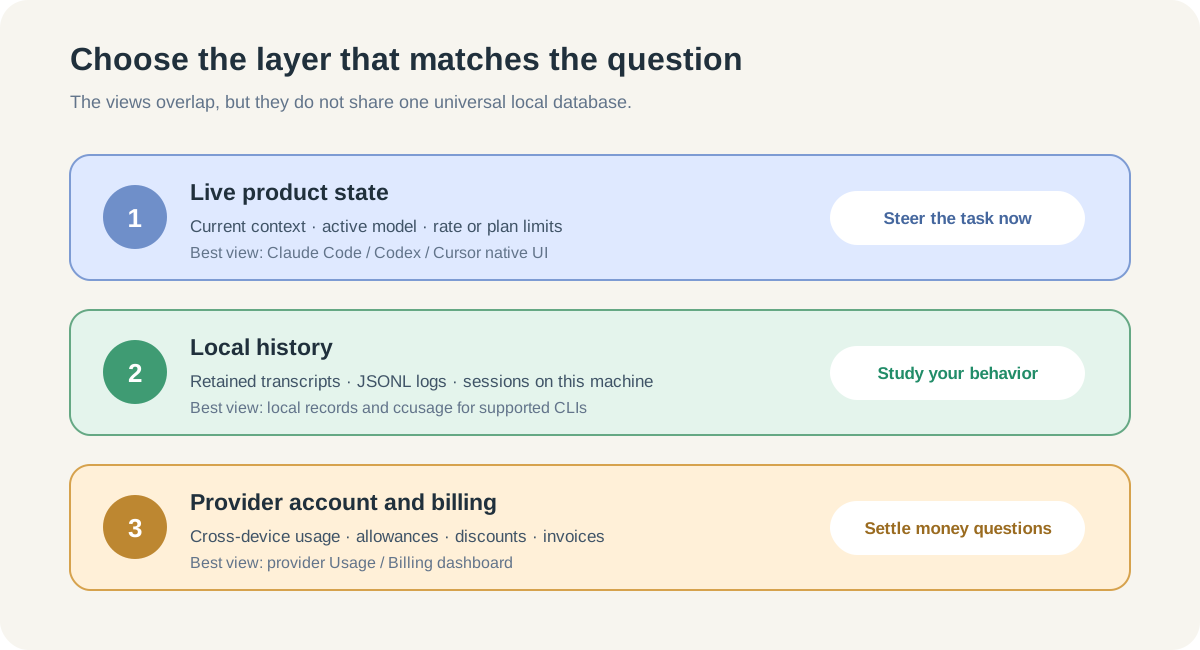
There are three practical observation layers:
- Live product state. The current conversation, context pressure, active model, and product-specific limits. Native UI is strongest here.
- Local history. Session transcripts or JSONL records saved by a CLI on this machine. Local analyzers can regroup these records by day, model, project, or session.
- Provider account and billing. Cross-device usage, contracted discounts, subscription allowances, invoices, and organization-level accounting. The provider dashboard is authoritative here.
The layers overlap, but they are not interchangeable.
For example, Claude Code’s current /usage breakdown can use local session history, while its plan information belongs to the Claude account. Codex exposes live context and rate-limit information, while its local session logs can support later analysis. Cursor’s account dashboard is a product-side view; it is not simply ccusage reading Cursor’s local editor database.
This gives us a reliable rule:
Use the native tool to steer the task, local history to study your behavior, and the provider’s billing view to settle money questions.
4. So what is ccusage actually for?
ccusage is useful when the question has a time dimension:
- Which day or session was unusually heavy?
- Did usage change after I switched projects or models?
- How do my supported local coding CLIs compare over the same period?
- Can I export a normalized local dataset for my own review?
According to its current documentation, ccusage reads usage files that supported coding CLIs already generated, analyzes them locally, and provides daily, weekly, monthly, and session views with estimated costs. Claude Code and Codex are supported; Codex log support is explicitly marked experimental because the log format continues to evolve. Cursor is not in the current supported-source list. See the ccusage introduction and data-source list and Codex source notes.
That makes ccusage a historical lens and format adapter, not a meter sitting between the agent and the model.
It is not automatically more accurate than the native product. Its value is different:
| Need | Best first choice |
|---|---|
| See what fills the current context | Native Claude Code, Codex, or Cursor view |
| Check a product plan limit | Native account or product view |
| Compare Claude Code and Codex local history by day/session | ccusage |
| Analyze Cursor account usage | Cursor dashboard |
| Confirm the amount actually billed | Provider billing console or invoice |
The only two ccusage commands a beginner needs first
You do not need to memorize a command catalog. On a machine that already has supported local records, begin with:
npx ccusage@latest daily
npx ccusage@latest session
The first finds an unusual day. The second connects the spike to a conversation. If neither view helps you make a decision, more flags will not rescue the analysis.
Because ccusage only sees supported local files on the current machine, missing history can mean deletion, retention cleanup, a changed data location, another computer, an unsupported tool, or a parser that has not caught up with a new format. Zero in a report does not always mean zero usage.
5. A practical investigation: the expensive “small fix”
Return to the twenty-line bug fix from the opening.
Step 1: inspect the live conversation
The native context view shows that terminal output and repository files occupy most of the context. This explains pressure in the current chat, but not whether the task was unusual for you.
Step 2: inspect local history
The session view shows that this conversation is one of the week’s largest. Looking back at the transcript reveals the real trajectory:
vague bug report
  → broad repository search
  → full test log returned
  → wrong hypothesis
  → another search
  → requirement clarified late
  → tests repeated
The model was not “wasting tokens” in one mysterious burst. The task accumulated cost through repeated context and extra turns.
Step 3: choose an engineering response
The useful response is specific:
- provide the failing test and acceptance condition at the start;
- return only the relevant part of a large log;
- start a new conversation when switching to an unrelated task;
- use a smaller or lower-effort model for mechanical follow-up work when quality permits;
- compare the next similar task, not two unrelated tasks.
Step 4: verify money in the right place
If the account uses API billing, compare the estimate with the provider usage page. If it uses a subscription, read the plan allowance rather than pretending the local list-price estimate is an invoice.
Now the data has changed a working habit. That is the point of usage analysis.
6. How to read a spike without blaming the model too quickly
Different patterns suggest different questions:
| Pattern | Likely explanation to investigate | Smallest useful response |
|---|---|---|
| Fresh input keeps growing | Long history, large files, verbose tool output | Clear unrelated history; narrow files and logs |
| Cache reads are high | A large stable prefix is being reused | Check cost before treating reuse as waste |
| Output is unusually high | Verbose answers, generated code, or high reasoning effort | Ask for concise output; match effort to the task |
| Many small calls accumulate | Search/test loops, retries, unclear acceptance | Clarify success criteria and cap the investigation |
| Parallel agents multiply usage | Each worker has its own context and trajectory | Delegate only genuinely independent work |
| Local report and bill disagree | Different scope, discounts, missing devices, unsupported events | Compare period, account, model, and data source |
High usage is not automatically bad. A production incident may justify a costly investigation. Low usage is not automatically good either; a cheap answer that produces a broken change is expensive engineering.
The useful denominator is an outcome: a verified fix, an accepted change, a resolved incident, or a reusable artifact. Token counts become management information only when paired with what the work achieved.
7. Privacy and accuracy boundaries
Local session records can contain prompts, source code, file paths, terminal output, and secrets accidentally printed by commands. Treat them as sensitive engineering data. ccusage states that its analysis is local and read-only, but exporting JSON or uploading a dashboard changes the boundary. Export only the fields you need and review them before sharing.
Also keep these limits visible:
- local history covers only the machines and retained files it can see;
- model pricing and product rules change;
- tool calls such as web search may have charges that are not represented by language-model token counts;
- subscription consumption and API list-price estimates answer different questions;
- two agents may package different system prompts, tools, and context for the same user request.
For a fair comparison, hold the task shape, success criteria, time range, and data source as constant as practical.
8. A ten-minute weekly review
You do not need a permanent dashboard. Once a week:
- Check the native usage view when a live session feels unusually long or crowded.
- Use local history to find one outlier day or session.
- Read the conversation and name the actual cause: necessary context, noisy logs, retries, changing requirements, excess output, or parallel work.
- Record one change to try next time.
- Use the provider view only when the question is allowance or billed spend.
A useful note is short:
Task: payment callback bug
Outcome: fixed and regression-tested
Why usage grew: full integration log returned twice; acceptance rule arrived late
Next time: filter the log first; write the expected callback states before editing
That note is more valuable than a colorful monthly chart with no explanation.
Verification checklist
After reading this article, you should be able to:
- explain why one prompt can trigger many model calls;
- distinguish context usage, session totals, plan limits, and billed usage;
- use Claude Code, Codex, or Cursor’s native view for live diagnosis;
- explain that ccusage reads supported local CLI records rather than intercepting model traffic;
- state that current ccusage supports Claude Code and Codex but not Cursor;
- trace an outlier from a report back to a concrete task behavior;
- choose the provider billing view when financial accuracy matters;
- protect local transcripts and exported usage data.
The goal is not to minimize every token. It is to notice when context, iteration, and model choice are producing useful work—and when they are merely repeating themselves.